
Spend less time debugging and more time developing !
The Issues we face
It’s really important to make sure that the apps we create don’t crash frequently. An unstable app leads to users not using the app and drives the users away from the away.

Even if we get crash reports or bugs reported, it’s really difficult to get to the root cause of a crash. This can be a time-consuming activity which is not something that can be afforded in today’s competitive market.
Getting additional information such as device info, network information, even the exact line where the crash happened and many more insights along with crash reports can be time-saving and can lead us to speed up our workflow.
The solution → Crashlytics
While we do have Firebase Crashlytics to help us with the issues mentioned above, it’s a topic for another day and today I’ll be talking about Sentry. This is a very popular SDK with features like crash detection, and performance monitoring with an extensive level of detail and supporting information that can be viewed on a really well-designed and user-friendly Dashboard.
Setting up Sentry Crashlytics
We’ll be first going through the installation steps and then setting up Sentry.
I am assuming you have a Barebone React Native Project setup. While Sentry also supports Expo React Native Projects, I will be using a React Native CLI project. For help setting up the project, you can go through the official React Native docs → https://reactnative.dev/docs/environment-setup
Once ready with a React Native Project setup, You’ll need to install the Sentry SDK package
npm install --save @sentry/react-native
we won’t be needing to link the package as it will be auto-linked.
Now, I’ll need you to create an account on the Sentry Site. While it’s paid for its complete feature set, you can still use it for free as long as you’re using it as a personal project and not commercially.
Once you have your account set up, you’ll need to create a new project in Sentry named whatever you want.
make sure you choose React Native as the Project type while setting up the project.
Now we will be running the sentry setup wizard in the cli that will help us with setting up the sentry SDK in our React Native Project. This will patch our project and connect it with your project setup on the sentry website. This will also allow us to upload source maps on each release of our app so that we can see the exact line in our app codebase where the crash originated from.
npx @sentry/wizard -i reactNative -p ios android
now go into the ios folder and do a pod install
cd ios
pod install
This will also configure Sentry SDK in your app automatically. In case it doesn’t, add this snippet to your App.js file
import * as Sentry from "@sentry/react-native";

Sentry.init({
  dsn: "https://examplePublicKey@o0.ingest.sentry.io/0",
});
Now wrap your app with Sentry to enable touch event tracking and automatic performance monitoring
export default Sentry.wrap(App);
And that’s it. You have Sentry installed and set up in your React Native Project.

Let’s test it out
Now we have Sentry Crashlytics setup in our project. To test it out we can try throwing an error
throw new Error("My first Sentry error!");
Sentry.nativeCrash();
or add the below code to cause a native crash
Sentry.nativeCrash();
Setting up Performance Monitoring
Performance monitoring helps us track our app’s performance. We can measure metrics like throughput and latency and display the impact of errors. To Enable tracing we’ll need to make some changes:
Firstly we will be adding the following code snippet to our App.js file.
import * as Sentry from "@sentry/react-native";

Sentry.init({
  dsn: "https://examplePublicKey@o0.ingest.sentry.io/0",
  tracesSampleRate: 1,
  integrations: [
    new Sentry.ReactNativeTracing({
      tracingOrigins: ["localhost", /^https:\/\//, /^\//],
      // ... other options
    }),
  ],
});
here, tracesSampleRate helps us control what percentage of transactions to send. Setting it to 1 while in development mode is a good practice to send 100% of the transactions.
Automatic Instrumentation
Sentry provides Automatic instruments for monitoring performance, which makes the setup really easy to set up:
Firstly, wrap your root component (App.js in most cases) :
export default Sentry.wrap(App);
Now we will be enabling Routing instrumentation
When no routing instrumentation is used, a transaction for App Start is automatically captured. However, that transaction stops being sent when one of the routing integrations below is added. Instead, the App Start information is included as a span in a transaction captured by the routing instrumentation.
Currently, Sentry has support for :
- React Navigation V5 and above
- React Navigation V4 and prior
- React Native Navigation
Follow the below guides for additional routing instrumentation according to your Navigation setup:
React Navigation V5 and above
import React from 'react';
import * as Sentry from '@sentry/react-native';
import {NavigationContainer} from '@react-navigation/native';
import RootStack from './src/navigation/RootStack';

const routingInstrumentation = new Sentry.ReactNavigationInstrumentation();

Sentry.init({
  dsn: 'https://examplePublicKey@o0.ingest.sentry.io/0"',
  // To set a uniform sample rate
  tracesSampleRate: 1,
  integrations: [
    new Sentry.ReactNativeTracing({
      tracingOrigins: ['localhost', /^\//, /^https:\/\//],
      routingInstrumentation,
      // ... other options
    }),
  ],
});

const App = () => {
  const navigation = React.useRef();
  return (
    <NavigationContainer
      ref={navigation}
      onReady={() => {
        // Register the navigation container with the instrumentation
        routingInstrumentation.registerNavigationContainer(navigation);
      }}>
      <RootStack />
    </NavigationContainer>
  );
};

export default Sentry.wrap(App);
React Navigation V4 and prior
import React from 'react';
import * as Sentry from '@sentry/react-native';
import {NavigationContainer} from '@react-navigation/native';
import RootStack from './src/navigation/RootStack';

const routingInstrumentation = new Sentry.ReactNavigationV4Instrumentation();

Sentry.init({
  ...
  integrations: [
    new Sentry.ReactNativeTracing({
      routingInstrumentation,
      ...
    }),
  ],
})

const App = () => {
  // Create a ref for the navigation container
  const appContainer = React.useRef();

  // Register the navigation container with the instrumentation
  React.useEffect(() => {
    routingInstrumentation.registerAppContainer(appContainer);
  }, []);

  return (
    // Connect the ref to the navigation container
    <AppContainer ref={appContainer} />
  );
};
React Native Navigation
You will need to pass the Navigation object imported from the library to initialise the routing instrumentation.
import * as Sentry from "@sentry/react-native";
import { Navigation } from 'react-native-navigation';

Sentry.init({
  ...
  integrations: [
    new Sentry.ReactNativeTracing({
      // Pass instrumentation to be used as `routingInstrumentation`
      routingInstrumentation: new Sentry.ReactNativeNavigationInstrumentation(
        Navigation,
      )
      // ...
    }),
  ],
})
Enriching events
there are other benefits of using Sentry. I’ll be going over them now

Adding Context
we can also add arbitrary data to an event and it will be viewable on the issue page
import * as Sentry from '@sentry/react-native';

Sentry.setContext("Address", {
  city: "New Delhi",
  pin: 110001,
  country: "India",
});
try keeping this data light and don’t send the entire application state as there is a size limit and Sentry will respond with HTTP error 413 Payload Too Large and reject the event.
Identifying Users
Users consist of a few critical pieces of information that construct a unique identity in Sentry. Each of these is optional, but one must be present for the Sentry SDK to capture the user:
- id: Your internal identifier for the user.
- username: The username. this can be used as a label instead of the internal id.
- email: this can also help in identifying the user
- segment: for apps that divide users into user segments, you can use user segment.
- ip_address: The user’s IP address.
import * as Sentry from '@sentry/react-native';

Sentry.setUser({ email: "john.doe@example.com" });

// you can also clear the currently set User :->

Sentry.setUser(null);
Sending Attachments
Sentry also supports storing additional files, such as config or log files as attachments.
how to upload attachments :
import * as Sentry from '@sentry/react-native';

// Adding an attachment
Sentry.configureScope(scope => {
  scope.addAttachment({ filename: "attachment.txt", data: "Some content" });
});

// Clearing attachments
Sentry.configureScope(scope => {
  scope.clearAttachments();
});
The Dashboard
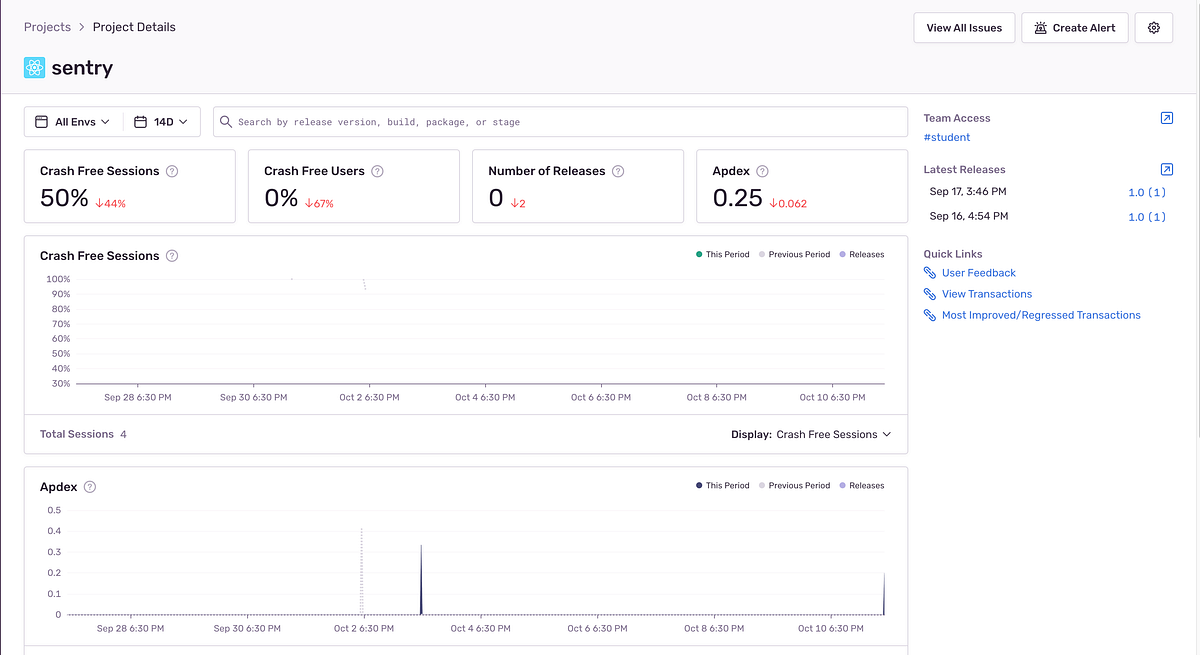
1. Project Dashboard
If you click on Your Project in the Sentry Site, You will arrive at the Sentry Dashboard for your Project. Here you can get a brief overview of what your app is doing.
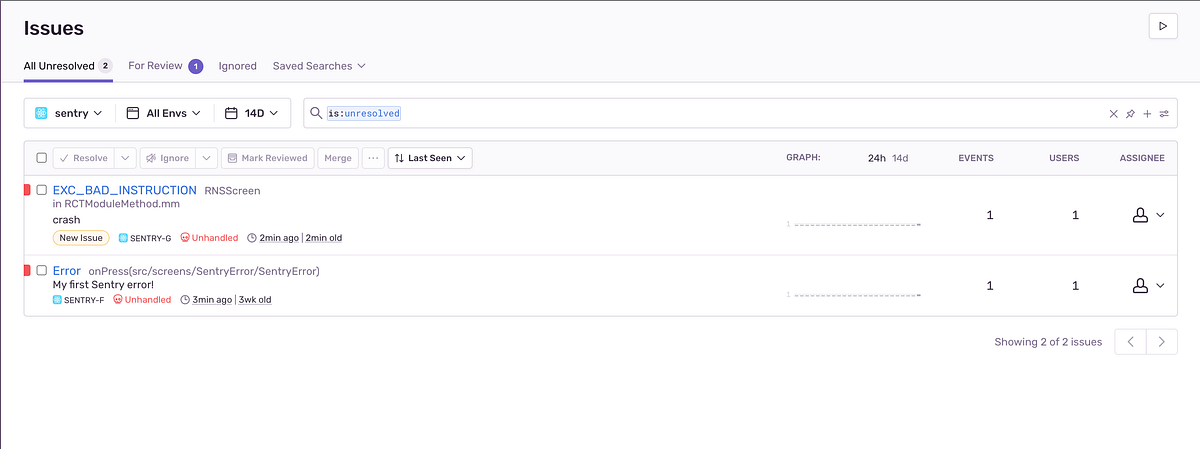
2. Issues Section
If you click on the Issues section on the sidebar, You will arrive at the Issues Section. Here you can view all the Issues/Crashes that have occurred. You have the ability to add filters and get various details about the crashes.
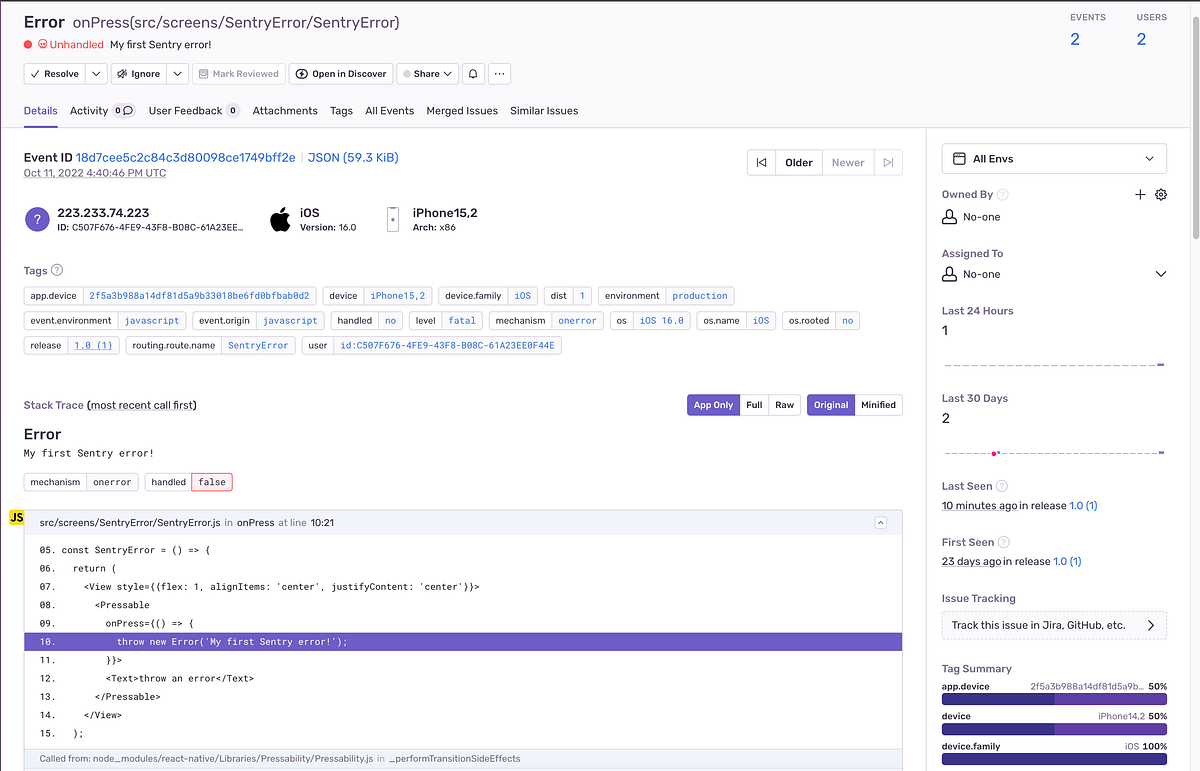
3. Issues Details
This is where we get the information we really want. You have access to all sorts of information like:
- When did the crash occur, how many times this crash happened, and when was the first time it occurred so you can track the crash
- You have access to the stack trace so you take a look at the exact line where the crash happened.
- What device this crash occurred on, what was the operating system and the version along with device information like model, free memory and whether the device is rooted or not
- You also have access to breadcrumbs which provide you with information as to what actions and changes led to the crash
- Along with a lot of additional information and features like who has it been assigned to and what its status is.
4. Performance Monitoring
if you click on the performance tab on the sidebar, you will arrive at the performance section of the dashboard.
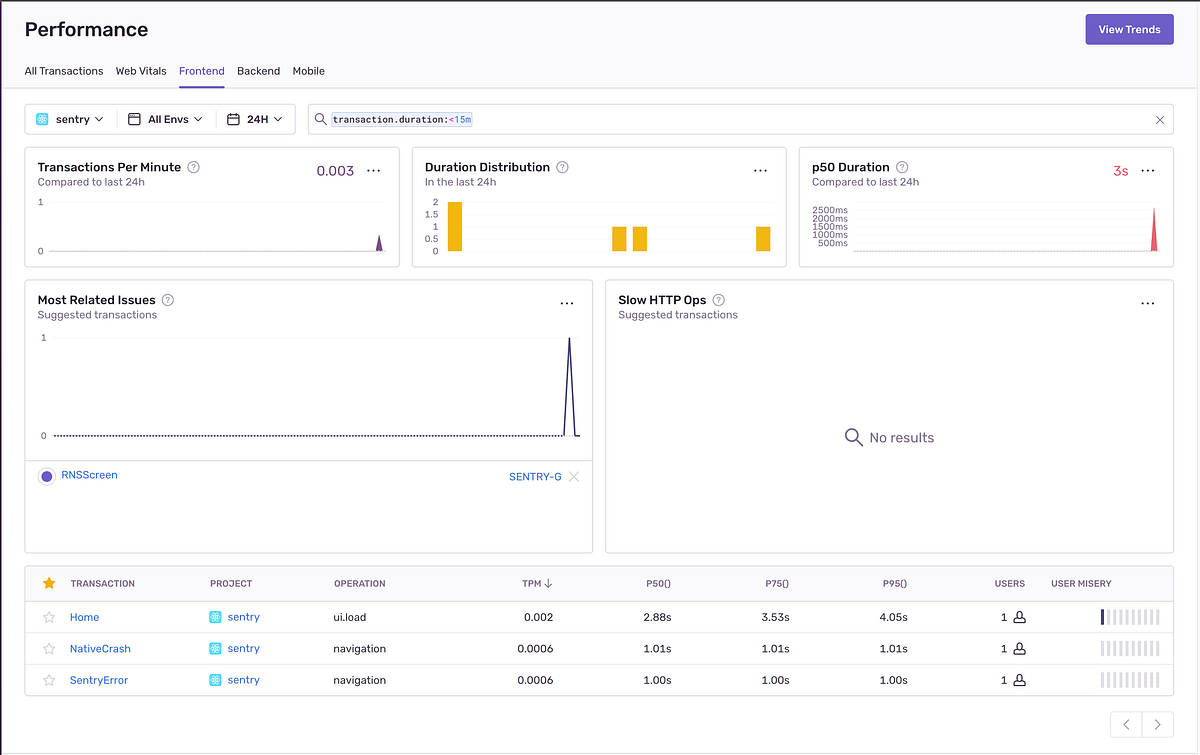
Here you can view the performance metrics like how many transactions are happening per minute and how their frequency changes during the day.
5. Transaction Summary
You also have access to specific transactions so you can take a better and more detailed look at the performance of specific transactions.
To access individual transactions, click on the transaction you want to get a better look at.
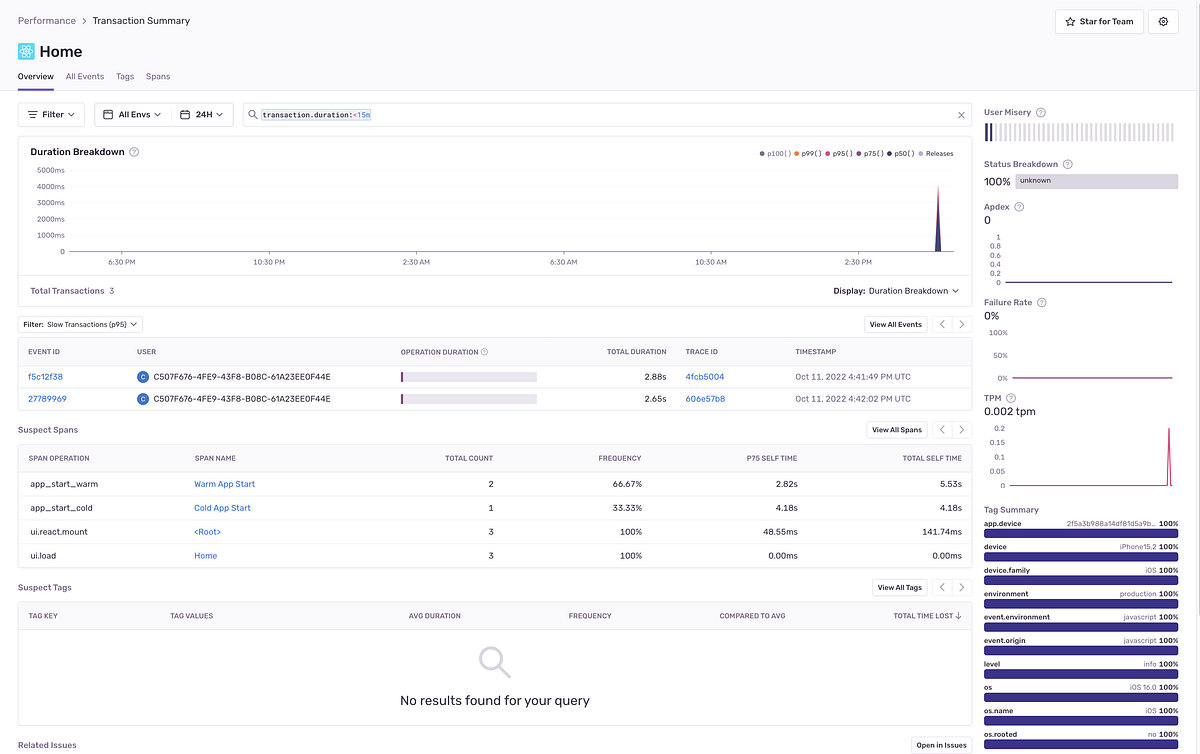
Here you have details about a transaction like how many times has it occurred and how much time it usually takes and what has contributed to this time.
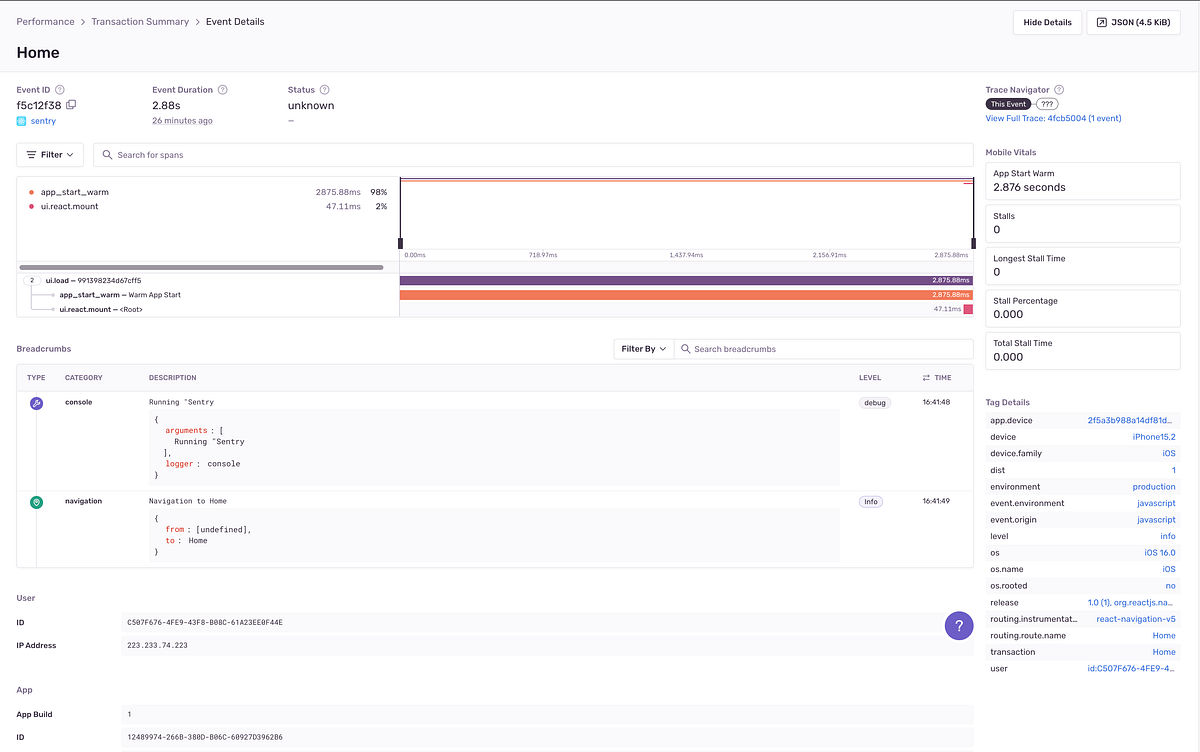
6. Event Details
If you want to take a look at specific events that you believe are outliers or may be causing performance issues. You can click on specific events and get more details about the specific event.
Conclusion
And just like that, now you are well aware of how Sentry can be beneficial to your app and how it can help you provide an app that’s stable and performs well. You also know what the different features of Sentry are and how they can be configured and then utilised through the Sentry Dashboard. While we have covered all the important features of Sentry, there is still a lot more that Sentry provides. For that, you can go through their documentation and use them as per your liking.
Thanks for reading and happy development till we meet next time.